World Refugee Day 2017

Today is World Refugee Day.

Currently, there are 65 million people forcible displaced globally and the number is growing every day.

The UN states that the World Refugee Day commemorates “the strength, courage and perseverance of millions of refugees. This year, World Refugee Day also marks a key moment for the public to show support for families forced to flee.”

To highlight this issue, international organisations such as UNESCO and many others have been actively promoting the stories, issues, data and conversations then need to be talked about as the countries individually and collectively struggle to deal with critical refugee issues.

The refugee crisis is an issue that every country has to deal with.

So below I have 3 ideas for Aussie cyclists to mull over* in honour of today’s theme.

3 Considerations for World Refugee Day 2017 

1. Is Australia really helping the Refugee Crisis enough? 

YES! It is!

SBS reported Australia’s current refugee involvement in a positive light by publishing the following encouraging stats:

$33.9 million has been raised in the last year (2016-2017) by Australia for UNHCR (United Nations Refugee Agency’s (UNHCR) official partner in Australia) to support the UN’s worldwide emergency and humanitarian programs.

Of the record $33.9 million that Australia for UNHCR has raised:

  • 75% are for UNHCR’s general emergency operations
  • 19% for emergencies in Syria, South Sudan, Iraq & Ecuador
  • 6% for specific projects providing targeted support for women, girls and children
  • $550,000 was raised by the community in NSW, QLD, WA and SA, to support Australia for UNHCR’s appeal for Syrian refugees.
  • There was also a significant contribution from Australia’s Vietnamese community, which has previously benefited from UNHCR support.

NO! Its not!

SBS’s report is a stark contrast to Tim Costello’s moving article entitled Even Poor Countries Are More Generous to Refugees than Rich Australia: Australia’s efforts would suggest we’re losing a sense of our shared humanity published in the Huffington Post.

Tim draws parallels between Australia’s efforts compared to Uganda (one of the top three refugee hosting countries in the world) and poignantly reflects that:

‘I was profoundly moved to witness how this relatively poor nation has welcomed hundreds of thousands of South Sudanese fleeing famine and war. How can it be that such a poor country does so much to shoulder the humanitarian load when we, rich and prosperous with a per capita income almost 25 times higher, do not?”

It is a sobering and honest point he makes that ‘we’re losing a sense of our shared humanity, which for a country built on migration is, at best, ironic’.

It is a very interesting article to read.

World Refugee Day 2017
Source: Huffington Post/Tim Costello Twitter

2. Ride for Refugees Event

Aside from wider political and economic furor – cycling and biking events are a great way to promote social issues and get people involved – so today is no exception!

There were many biking events and rides this year, but my cycling event for World Refugee Day 2017 goes to Nepal’s ‘Ride for Refugees’. This is the second year this event has run and 2017 saw a turnout of over 500 people. Spotlight reports that people riding included ‘government officials, diplomats, refugees of diverse nationalities and local residents of the Kathmandu Valley showed their solidarity with refugees — both in Nepal and globally — by participating in the second annual “Ride for Refugees” cycle rally south of Patan’.

Aside from riding  in the critical mass event with all the locals, celebrities, ex-pats, supports and the like, Kathmandu is hosting an array of ‘Refugee’ events throughout the city including a photo exhibition, site visits and discussion meetings.


World Refugee Day 2017
Source: Spotlightnepal.com. (From L to R) Swiss Ambassador to Nepal Jörg Frieden, UNHCR Representative in Nepal Kevin J Allen with Miss Nepal Asia Pacific, Sahara Basnet and Miss Nepal Earth, Rojina Shrestha at Patan Dubar Square for ‘Ride for Refugees’
World Refugee Day 2017
Source: UNHCR

3. The Nashville Food Project Celebration

To keep the fun and community in perspective I’d like to acknowledge a smaller grassroots honorable mention from last year (2015) – undertaken by The Nashville Food Project. You cannot go wrong with friends, family, food and farming!

As stated on their website, this lovely inclusive event was a collaboration and art project for World Refugee Day included such a meal. The Nashville Food Project joined friends from the First Center for the Visual Arts, the Center for Refugees and Immigrants of Tennessee, Oasis Center and members of their International Teen Outreach Program, Bhutanese gardeners and neighborhood gardeners at the Wedgewood Urban Garden.   

“I just loved sharing a meal with all these people who came together around growing food, volunteerism, making art and celebrating World Refugee Day,” said TNFP Garden Manager Christina Bentrup. “There were people and foods from both around the world and from different neighborhoods around Nashville, It was a multi-ethnic, multi-lingual, multi-generational group of folks celebrating community and diversity. It doesn’t get much better than that.” 

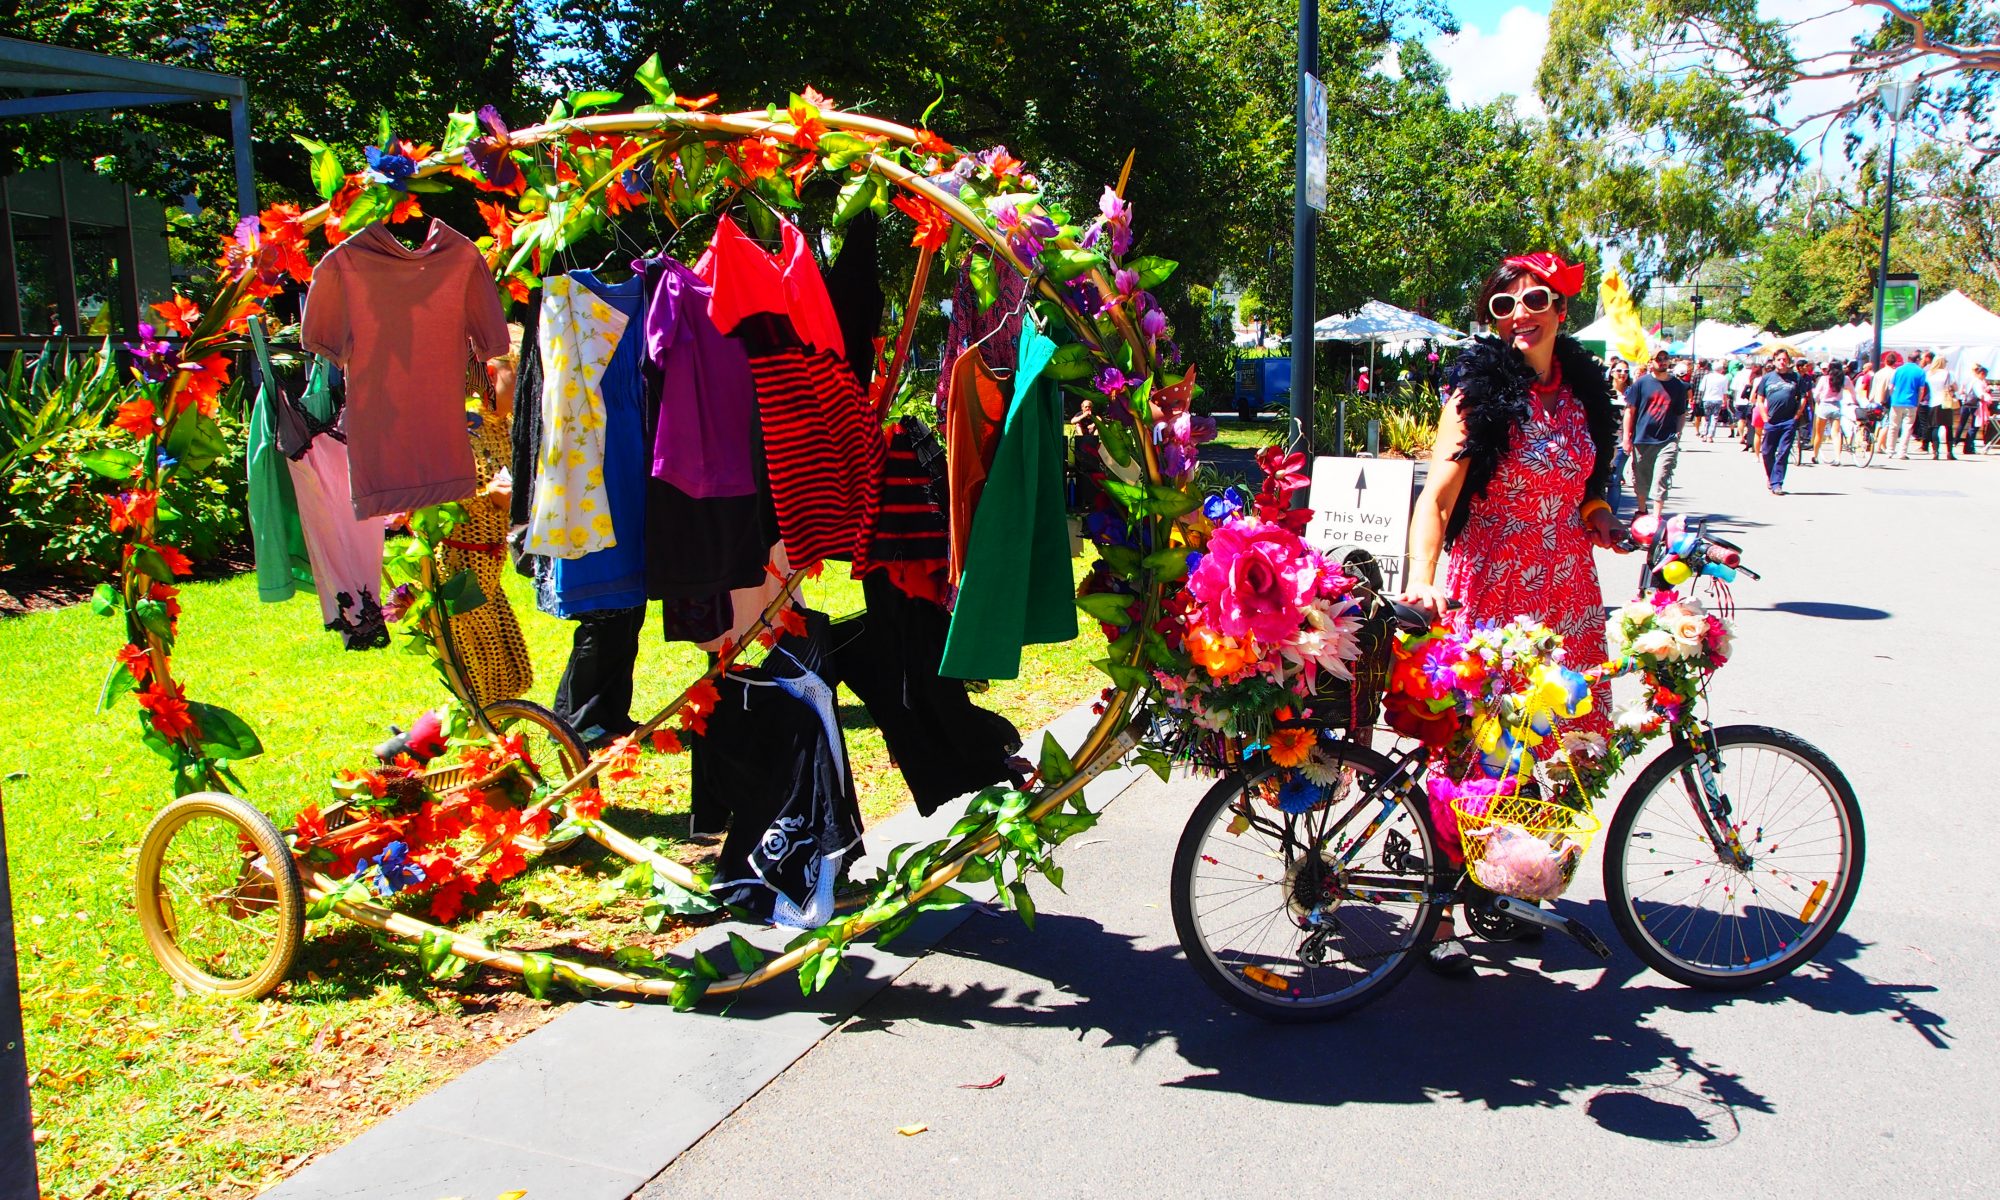
The group also turned recycled bicycle parts into art for the garden (see below) and then had a big community pot luck lunch together!!

At the end of the event description on their website is a great squash recipe, which to me highlights the significant interconnection between community, food and garden.

What a wonderful way to celebrate the day!

World Refugee Day 2017

World Refugee Day 2017
Source for these 3 images: Nashville Food Project


How did you celebrate World Refugee Day 2017?

How about next year planning some grand celebratory biking plans that will bring together locals, refugees and community?

Infuse it with welcomeness, fun, inclusivity and of course… biking!!

Best of luck for next year’s bike-themed World Refugee Day event!


*Note the two  news articles used for point ‘1. Is Australia really helping the Refugee Crisis enough?’ should be taken as a stimulus to explore your own reflections (and reasons for your answer) to this question. The two articles included have been artbitrarily selected as two opposing points of view on this topic and are not to be taken as definitive or sole proof of (or any other variation of) this position. So please use your amazing brain. Research and make you own mind up based on the best quality and relevant information.

Research on the ‘sharrow’ in cycling infrastructure

This guest post is by Dr Mike Lloyd, a NZ academic who contacted me after I featured his article on the recent MTB bike rage incident that was caught on video and went viral. This post remains the one of the most popular BCC posts. His follow-up article examined ‘the spatial, temporal and interactional order of a rare case of cycle rage’ and looked at the same incident from a videography analysis to uncover the details of a MTB track run ‘gone wrong’. Both are well worth the read! It an absolute pleasure to present Mike’s first guest post – we hope to be hearing more from him – Enjoy! NG.


The Road Ahead: Research on the ‘sharrow’ in cycling infrastructure

(A summary of research by Dr Mike Lloyd, Max Baddeley, and Dr Ben Snyder, School of Social & Cultural Studies, Victoria University of Wellington, New Zealand; the full paper is currently under submission with an academic journal)

‘Sharrows’ first appeared in California in the early 2000s and have now been officially mandated for use on roads in many countries including Australia and New Zealand.   Our research looked at new cycling infrastructure in Wellington, New Zealand, specifically a 450 metre stretch of road where the designers stopped Copenhagen-style cycle lanes and reverted to more standard road space marked with sharrows (short for shared lane arrow).  Here is what a sharrow looks like in this space.

Research on the ‘sharrow’ in cycling infrastructure
The sharrow is the white cycle with double arrow sign painted in the middle of the red area (indicating a 30kph zone).  For the SUV driver, in this context the sign can mean, ‘be alert for cyclists ahead, and share the road if you come across them’.  This is consistent with aspects of sharrow use in Australia where they are referred to as a ‘Bicycle Awareness Zone’.  This also conforms to the New Zealand ‘best practice’ guidelines which say the sharrow ‘helps reinforce that the carriageway is a valid place for cyclists to travel (reinforcing to other road users to act accordingly’).  The interesting question is ‘where exactly should the cyclist ride?’  Looking at the bottom panel, we can see that there seems to be some guidance in this regard: the widening green bars seem to direct the cyclist to move into the middle of the road, exactly where the sharrows signs are positioned.

A quick googling of ‘sharrow’ would confirm this, as phrases like occupy- claim- or take-the lane will crop up.  However, this is not a hard-and-fast guideline for how a sharrowed area should be ridden.  Traffic experts emphasise that the sharrow is there to help the cyclist occupy the traffic lane when it is safe and appropriate to do so.  So, key questions are: ‘when’ should a cyclist claim the lane, and in doing so ‘where’ exactly should they position themselves in the lane?  Further, any cyclist will also know that it is not only the road ahead they need to be concerned with, but the road behind.  If a cyclist occupes the lane with cars behind, how will those drivers react?  A first way into this issue is to look at the process of attempting to claim the lane in the transition from the Copenhagen-style cycle lanes to the sharrow area.  This is where the widening green bars come into play, but as we see they are no guarantee of success:


Research on the ‘sharrow’ in cycling infrastructure

Panels 1 to 3 show a cyclist attempting to claim the lane, but in response the driver of the white car speeds up not allowing the cyclist ahead.  In contrast, panels 4 to 6 show success: as the cyclist moves out the driver of the green car backs off, allowing the cyclist to ride ahead claiming the lane.

We do not have a breakdown of the ratio of success to failure in claiming the lane as this was not our goal, however, it is worth noting that our research involved one of the researchers riding to claim the lane; in reality, it is rare to see other cyclists doing so.  Mostly, cyclists revert to a default line to the left of centre.  This is a pity, because as we rode we discovered that sharrows can work to make cycling safer in traffic spaces where cycle lanes are not present.   Here the effect of raised pedestrian crossings and four speed bumps within the sharrow area was signficant. The entrance of both ends of the sharrow area features raised pedestrian crossings, and whereas a cyclist can ride over these with little decrease in pace, vehicles slow to a greater degree, thus giving the cyclist a chance to maintain a lead ahead of vehicles.  When the vehicles get over the raised crossing and increase their speed, catching up with a cyclist, the speed bumps repeatedly give the cyclist a ‘breathing space’.  Of course, this all depends on the speed being travelled: this ‘breathing space’ effect works for a car obeying the 30 kph limit, but not for one travelling significantly over this speed.  Needless to say, not everyone obeys speed limits.

Also, once claiming the lane, there can be a reduction in the temptation to ‘filter’. When there are parked cars to the left, but the central line of traffic is slow or stopped, it is very common for cyclists to ‘filter’ between the cars –  a dangerous area to be cycling in.  Our cyclist’s impression was that once riding to ‘claim the lane’, when the traffic slows, filtering to the left is not so ‘automatic’, rather the cyclist may just slow their pace to match the vehicles ahead, thus reducing the risk of riding in the dangerous space between cars.

This good news has to be tempered though by one of the main findings of the research.  This has to do with how difficult it is to predict in the design of cycling infrastructure how drivers and cyclists will actually interact on the built road.  Small details can be remarkably important, yet hard to plan for.  We were able to realise this because of our dual camera research method, that is, our cyclist had a GoPro camera pointing forward on his bike handlebars, and a rearwards facing camera mounted on his helmet.  The folllowing three visuals capture a near-dooring incident.

Research on the ‘sharrow’ in cycling infrastructure

In panel 1 the cyclist is riding past three parked cars and a motorbike, and just as he is adjacent to the motorbike, the door on the silver car starts to open.  The video record does not allow us to be definitive, nevertheless, in our view two things can be noted.  First, the opening of the door is a continuous movement (see panels 3 and 4), and second, from a careful scrutiny of panel 4, the car driver is looking forward, not behind or to the right where the cyclist is approaching.  It does not seem either that the driver is looking into a rear-view mirror to check for any vehicle or cyclist behind, nevertheless, we certainly accept that this could be the case.

Interestingly, the inability to be definitive on this point is not of crucial importance, because the more pressing question to ask is, why was the cyclist not aware of the door opening?  This is sensible to ask because, as shown in panel 3 of figure 6, it has opened sufficiently enough for it be visible.  Experienced cyclists develop a strong sense of where they are cycling in relation to parked cars and the potential at any moment for a door to be opened on them, meaning that even a door opening to 10 centimetres is probably detectable. But there is no evidence that the cyclist sees the door opening, as he certainly does not change his line in response to the opening, even though by the time he is directly adjacent to the door it may well have opened even further than seen in panel 4.

In an ‘aha’ moment the answer was provided by consulting the rearwards-facing video record, filmed simultaneously.

Research on the ‘sharrow’ in cycling infrastructure

In panel 1, the cyclist has entered the sharrow area, claiming the lane with the consequence that the silver MPV behind him slows.  Just after panel 1, the vehicle comes closer but then backs off, continuing to follow at a reasonable distance (panel 2).  Just before panel 1, the cyclist has looked behind and seen the silver MPV, so he is aware of its presence while he rides centrally ahead of it.  Panel 3 provides the answer to the question of why the cyclist was unaware of the car door opening.    At precisely the moment when the car door begins and proceeds to open, the cyclist is looking behind (hence, the tilted screenshot) to see where the silver MPV is in relation to him.  This fully explains the ignorance of the door opening, but, as captured in panels 4 and 5, we now have a much more extensive idea of what happened.  We see that the door was fully opened with the driver emerging onto the road, and we also see how dangerous this situation was.  As indicated by the yellow arrow, the cyclist’s line was directly in the path of the fully opened door.  It was probably only by a matter of micro-seconds that he escaped being doored.

There is more that can be learned from this data, for another pressing question needs answering: if the cyclist was claiming the lane in the sharrow area, why, at this particular point, is he riding a line within the dooring zone?

Research on the ‘sharrow’ in cycling infrastructure

The answer is available in the subtle change of line prior to the place where the near-dooring occurred.  In panel 1, the cyclist approaches the raised pedestrian crossing riding in the centre of the road, and in panel 2 is seen riding straight over the sharrow sign.  Panels 3 and 4 show though, that just before he gets to the speed bump, there is a subtle alteration in line, taking him leftwards and closer to the line of parked cars. This alteration in line is first due to riding around a manhole cover in the road, which takes the line towards a second cover in the road (at the head of the top arrow), which is also ridden by moving to the left.  These slight alterations in line are continued by riding to the left of the speed bump, the line then maintained towards the circled area ahead (panel 5) where the near-dooring occurs. The cyclist is clearly picking the line of ‘least resistance’ in relationship to the bumpiness of the road, which results in moving him further and further to the left, away from the sharrow line and into the dooring zone.

The subtlety of such alterations in line would be difficult for road designers to predict.  Moreover, other things can happen in the same space that lead the cyclist to a different line.

Research on the ‘sharrow’ in cycling infrastructure

This second door opening occurs well before the cylist, but is also at a time when the cyclist is riding to the right of the sharrow line, so that he is well clear of the opened door.  This is because the transition from the raised pedestrian crossing to this location has no material objects that encourage alteration in line.   In panel 2 we again see the alteration in line around the cover, but this time when the cyclist gets to the speed bump (panel 3), he rides through the middle.  The reason for this is visible in panel 4: he looks ahead and sees a parked bus taking up significant space in the road, so he anticipates the need to go wider and adjusts his line out more centrally in the road, coincidentally taking him well away from the dooring zone.

So, the exact lines ridden are clearly not solely determined by the material features of the road, rather there is a complex entanglement of the social and material in any particular riding through the sharrow area.  There are patterns in how a sharrow area is ridden, but at the same time these are not sufficient to predict the course of any moment’s riding through this new cycling infrastructure.  The particular line taken in any particular moment is part of a ‘wild phenomena’. To decide on the degree of success of any new cycling infrastructure requires close attention to the detail of how cyclists and drivers actually interact. Thankfully, the availability of cheap and easy-to-use action cameras makes data-gathering relatively simple, leaving the researcher with the difficult task of unpacking the fine detail.  It is an important task that may lead to improved cycling infrastructure design.

Best of Bike Futures Conference 2017

On Friday I went to the Bike Futures Conference 2017 in Melbourne St Kilda. Here’s quick review of the highlights.

Who attended?
This was my first Bike Futures Conference and I wanted to make the most of it after travelling down from Brisbane. There were over 150 local council representatives, engineers urban planners, school staff, public servants, bike advocates, academics, local residents and many more. Essentially this one-day conference was an opportunity to share current projects and discuss some of the main challenges, success and practical tools that various divisions around Melbourne have been working on. The main aim is to increase, make safer and improve urban cycling conditions. This was a great opportunity to connect and learn from industry experts and peers.

Conference Format
As well as the guided ride to the venue, the conference format was broken into three main sections. You can see the full program of topics and a full list of presenters which shows the range of issues and areas the conference covered.

Guided ride
My conference day started at 8 AM at Federation Square for the guided ride to the venue. There were 18 delegates on the ride, and it was a stunning morning.  Our route took us from Federation Square to St Kilda Town Hall showcasing some of the best of Melbourne’s bicycle-friendly infrastructure. We had three stops at key locations along the way where we heard representatives from Vicroads, City of Melbourne and City of Port Phillip speak about specific bicycle infrastructure, current projects and considered future developments.

Not only was it great as a social ride (I made a point of chatting to others when safe to do so), the presentations themselves were very informative.  I was also relishing being back on two wheels on Melbourne roads – I was flooded with memories and emotions as I relived endless glory days of pedalling in and around Melbourne on some of my favourite adventures with some of my favourite people.

An added highlight was riding along the Formula One Grand Prix track at Albert Park – something I just can’t do in Brisbane, and it added an extra festive zing to my day.

Riding the F1 Grand Prix track
1. Key guest speakers
1.    Claire Ferres Miles (General Manager, Place Strategy and Development, City of Port Phillip). This was a solid start to the conference good overview of projects and update of current and future plans for active transportation.

2.    Professor Chris Pettit  (Inaugural Chair of Urban Science at the University of New South City Futures Research Centre). Chris’s presentation was very interesting. It was research and a little nerdy. His work focuses on spatial planning and use of GIS and mapping technologies to investigate land-use change scenarios. He showed an impressive simulation based on Melbourne riders using the Logmyride app (I’ll do a follow-up post on this as it was very cool!!).

3.    Toby Kent (Chief Resilience Officer for the City of Melbourne). Far out – what a presenter. Not only an unexpected addition to the conference given the seemingly loose connection Melbourne City’s Resilience status has –  but Toby managed to connect with the audience, be squarely on topic, appropriate and clearly linked what his Office does to the audience’s experience – and a super charismatic orator.  Quite spokes, calm and very well prepared, I can see why he is in the top leadership role.

4.    Luke Donnellan (Minister for Roads and Road Safety). As would be expected, Luke coped quite a lot of flak – and deservedly so. Not only was he in full politician style of not directly answering questions, he missed the mark on a number of key issues, put his foot in his mouth by disrespecting a Western Council representative (of which she challenged him on very appropriately!) and was a terrible speaker by reading off his notes in a monotone and completely disinterested and unengaged way and made no attempt to looking at the audience at all. And then promptly ran away. Oh dear!

Sean Yates - Vicroads

2. Pecha Kucha Sessions
This format is quick and interesting, with each presentation having 20 slides (for 20 sec each) being about 6.5 min in total.
1. Evaluation of Bike Ed in School – Che Sutherland (Team Leader – Darebin Council)
2. St Kilda Road Safety Improvement – Sean Yates (Project Development Engineer -Vicroads)
3. Low-stress cycling in Whitehorse – Amy Child, Arup & Lean McGuiness (City of Whitehorse)
4. Greening the Pipeline Project – Emma Pryse (Project Coordinator – City of Wyndham).
5. Bike Safety and trucks Jamie Ross (Safety Officer – Metro Tunnel Project)

Bike Futures 2017

3. Afternoon Break-out Workshop sessions
After lunch, we split up across different rooms to attend our registered session themes.

Session 1: Jump starting Active School Travel
Investigating a very successful case study of Park Orchards Primary School. This workshop explained the process and strategies used to link parents, teachers and community member together to provide a ‘perfect storm’ for a community active transportation initiative spanning a school term in 2012. With a review three years later, the positive behaviour changes in kids and families using more active transportation to go to school was impressive. This workshop was generous in providing details, suggestions and insights of how the project was designed and what elements conspired to make it such as success. It is now considered the Gold Standard of what other schools could achieve. A great session that stimulated lots of conversation and was very through-provoking and inspiring.

Session 2: Getting Girls and Women Riding
This session was run by Bicycle Network and was reporting back on two initiatives – getting more teenage girls (high school) on bikes via a specific program designed just for teenage girls, and getting more women on road bikes via the Ascent event. This session was particularly interesting for me given the unique (and negative) experiences that the Ascent team had in organising and putting on the original 700+ women’s only road cycling event – and the subsequent difficulties they encountered trying to do it again the year after.

Bike Futures 2017
Wrap up
The notion of sharing new ideas about a range of new ways in which bicycles create positive community change was a fitting way to conclude the 2017 Bike Futures Conference. The conference closed with Bicycle Network’s Chief Executive Officer, Craig Richards call to action to “dream bigger make it happen”. After the official close, we then mingled and finalised any contact, got our bikes and those who were up for it headed to the pub across the road for social drinks and to continue informed and passionate discussions.

Final thoughts
For me, the best part of the conference was able to meet such a range of diverse people. From teachers, academics, health professionals, industry experts (lots of E-bikers) BUGers, engineers, transport technicians and lots of local council representatives.

The enjoyed being able to sit and listen to the presentations and take what I needed. I met a wide range of very interesting people and practised talking about my research and this blog. In fact, at one stage I went up to some Bicycle Network delegates to thank them for putting on the conference and I mentioned my work, the instantly connected me with another Bicycle Networker called Alex who is working in India with a Bike Aid program and we ended up finding a quite nook to have a good chat – awesome!

I had a great time at the conference, got some great new ideas and felt re-inspired. It made me miss not being in Melbourne amidst this charge of new bicycle development, but also provided some valuable food for thought and some wonderful new contacts. I was very happy I made an effort to go down to Melbourne to attend this conference.

Bike Futures 2017

Preventing car dooring in NSW

This morning I am heading interstate to NSW for a week.

After registering for the upcoming Bike Future 2017 Conference in Melbourne, I find myself wanting checking up on the some of the latest urban bike programs and initiatives being undertaken south of Queensland’s border. So I started looking into some key current cycling issues, changes and policy directions happening in NSW and Victoria.


Think of the Impact – Car Dooring Awareness Program  – New South Wales (NSW).

In investigating all sorts of programs, one Sydney program that caught my eye. It focuses on the issue of car dooring and the program is called Think of the Impact. It turns out that the major hot spots for car dooring in Sydney are Kings Cross, Newtown and Surry Hills. After recognising the obvious increase in people cycling, having seventy-four car-dooring incidents reported and under pressure from local cycling advocate groups, the Think of the Impact initiative was created.

This project was undertaken as a Sydney Cycles Ways project in collaboration with City of Sydney and NRMA Insurance. It was in response to the increasing levels and problems of cycling in Sydney. I’m not going to rehash the background of this program because if your keen to read more  about this NSW project and its origins – you can find it here.


Car dooring of cyclists is an issue in major cities

I had not seen this particular program before. It rally struck an immediate cord with me as car dooring was an ongoing and critical issue when I was commuting every day to work by bike when I was in Melbourne. I had a few near misses myself and I saw many others car dooring situations as well, with various outcomes. It was a very challenging – and was a very real clear and present danger.  It was something that many Melbourne cyclists talk about as well. It was interesting to hear that the issue of car dooring and urban cyclist safety is a similar and prevalent concern in Sydney (NSW) as it was in Melbourne (VIC).

In NSW, car drivers can be fined $319 and lose 2 demerit points if they pass too close to cyclists.

As of 2012, Victoria increased penalties so that car dooring fines now incur a maximum of ten demerit points, and fines have since increased from $423 to $1,408.

I’ve noticed that in Brisbane (and Queensland in general), there is a clear media reticence about reporting car dooring and cyclist safety in general. It is certainly not a key media or community issue or nowhere near mentioned as often in the media as it is down south. Car dooring is definitely a bike safety issue in Brisbane, but local media reports of cycling in Brisbane do not highlight car dooring as a major traffic or cycling issue. In fact, most Queensland media reports on road/urban cycling in Brisbane detail fatalities. Fatalities are the most reported cycling safety issue in Brisbane given the lack of bike lanes or shoulders, heavy reliance (and love) of large motor vehicles such as 4WDs, trucks and utes with boat trailers, minimal bike infrastructure and heavily congested road traffic.


Why this particular program?

Sydney Cycles Ways is responsible for this program and decide to run the program based on compelling data of local cyclists’ car dooring experiences. As a quick check in with the cycling community Sydney Cycles Ways, mid last year did a quick online survey via Twitter to get some feedback re car dooring occurrences, and this is what they found:

Source: Think about the Impact

Free stickers to promote awareness of urban cyclists

Another reason why this NSW program is particularly interesting and proactive – is that it offers free stickers for cars to remind and promote other road users (car drivers specifically) about car dooring – hence the name of the program.

The idea is to get more car users actively checking for cyclists before opening doors.

Here are what the smaller stickers and larger (car) stickers look like:

Source: Think about the Impact


Source: Think about the Impact


I have not seen these stickers before, but then again, I don’t live in Sydney. I wasn’t aware that this program had been launched in NSW and so I missed out on knowing that the public could order sets of 4 small rear mirror stickers and/or larger car door sized stickers in two colour choices – for free. Apparently making merchandise available for free to the general public as part of an awareness-raising campaign is a pretty effective strategy to get more people participating and publicly sharing the message.

This was especially the case for this program, where the response to these free stickers was very encouraging. By halfway through 2016, there had been a great community response to the program and 20,000 stickers had been requested.

I went online yesterday and ordered 4 sets of the small stickers and one large car sticker. I’m keen to see what they look like.

I can immediately see the attraction of the smaller stickers, but I’m not sure about the car door stickers – realistically how many people would put the large sticker on their car door – would you?

If you would like to order a free set of stickers that will be posted to you – click here.


Source: City of Sydney


For more information about this program, contact City of Sydney Senior Media Adviser Bridget Ahern, phone 0423 505 854 or email bahern@cityofsydney.nsw.gov.au

Bike Futures Conference – Melbourne 2017

One of my goals for this year is to support and attend more bicycle infrastructure, policy and research events.  After all, 2017 is the ‘Year of the Bicycle‘ and my research is entering a stage where it really has social viability, so looks like I’ll have to dust off my dancing shoes for a few shindigs!

So to kick off the year right, I am heading down to Melbourne in a few weeks to attend my first event of the year –  Bicycle Network’s Bike Futures Conference 2017. Tasmania and Sydney have already held their state conferences and there appears to be no state conference set for Queensland – at least not in 2016 or 2017 that I have found. (Oh  dear Queensland! Not again!! Such a pity you are always so far behind the world and rest of Australia when it comes to supporting any kind of progressive cycling or biking – tsk, tsk – perhaps this is the year to turn it all around!!).

So it’s off to Victoria!  It is also a great excuse to revisit to my old hometown and see some family and friends after being away for what seems like an age!

Bicycle Network Bike Futures Conference 2017

This is a one-day forum aimed at bringing together researchers, policy-makers, bike advocates, businesses, government agencies and others to share the latest developments in cycling provision. The overall aim is to improve biking conditions and encourage more people to ride bikes. The program details a good range of speakers confirmed from various educational, business, political, health and social spheres.

On the day there will be plenary discussions, presentations and workshops on a range of topics (see tentative program below) such as safety, planning, behaviour change and various urban uses and infrastructure approaches.

I’m very excited to hear what cycling development Victoria has implemented over the last 2.5 years since I have been away and to hear what has – and has not worked. It will be a great opportunity to make some contacts and network as well. The program looks diverse and engaging and I am keen to attend pretty much every session!

I am going as I want to make some industry contacts and hope to hear about a range of interesting, challenging and/or informative sessions. I’m looking to get inspired – and hopefully, the event will also help stimulate and distill some new ideas. If I am really lucky, maybe it might even open up some new directions on how I can apply some key learnings from Melbourne’s experience to my own PhD research project.


Opportunity to scout some new BCC blog talent and features!

I’m going to make the most of this trip to Melbourne. To do so, I am also organising some introductions, meetings and site visitations while there. I’m keen to catch up with some old friends and see what has changed, and to follow up on a few leads featured previously on this blog – and to make some new contacts to feature as well!

I’m also looking forward to riding around Melbourne and rediscovering her biking treasures and secrets.

It is a great opportunity also to investigate what cycling events are going on in and around Melbourne.

So if you know of any biking research or events happening in Melbourne from Feb 7th – Feb 21st, 2017 that you think is worthy of a look-see, or want to recommend a person, group or event I should contact for this blog, please let me know via the comments box below. Thanks in advance! I would really appreciate your suggestions!


Morning Bicycle Network

Bicycle Network
Source: Bicycle Network


UN: Global Outlook on Walking and Cycling Report

Today’s post focuses on the recent UN: Global Outlook on Walking and Cycling Report by the UN Transportation department. The report is officially entitled Global Outlook on Walking and Cycling: policies a & realities from around the world and was released September 2016. This 70-page report is focuses on investigating issues of active urban transportation in middle and low-income countries. It outlines current major road accident risks, and describes some effective interventions that are being employed to save lives and increase mobility for improved future livelihoods.


UN: Global Outlook on Walking and Cycling Report

It identifies a few key concerns that are no surprises

  • active transport is safer
  • better for the environment
  • uptake is restricted due to a lack of infrastructure and investment
  • unsafe roads are a major social issue
  • increasing impact and amount of road deaths
  • transport is a key issue as it generates nearly ¼ of all carbon dioxide emission and is the largest contributor of greenhouse gases

Handy Acronyms for dinner parties
NMT– (Non-motorized transport) – such as walking, cycling animal carts, skateboarding, cycle rickshaw, hand-carts
IMT (Intermediate Modes of Transportation) is a broad term for low-cost transport that essentially fills the mobility gaps needs between walking and having a car. So push bikes are included as are low engine-capacity motorbikes and tricycles often with adaptions such as side cars, trailers and other load bearing modifications.
SDG – UN Sustainable Development Goals

Data collection
Stakeholders from government and civil society in 20 countries were surveyed three times over a 3-month period (March – May 2016). Stakeholders were invited to suggest other research participants as well to expand the research pool.

I thought it was interesting that in the data collection, only ‘stakeholders’ were invited to participate. So this means only people from ‘a range of independent or university institutes, global agencies, non-government organisations, consultants, individual activists or government officials’ participated in this study. The rationale given was that they these people were ‘more likely to have insight into and knowledge of NMT policy status and access to data in their region, country or city’ (p 10).

Summary of key findings

  • 1.3 million people died in road accidents last year = one every 30 seconds.
  • Need for nations/cities to have some level of (national) NMT commitment
  • Increase in global awareness to the intersection of poverty and transportation about the UN SDGs.


Key NMT policy themes

Source: UN Global Outlook on Walking and Cycling Report 2016


What are the current types of NMY commitment – Transport Policy, funding policies for facilities, National Policy, Infrastructure Acts, related-by-laws, Strategic Frameworks, etc.

Type of supporting policies that will support the overall NMT commitments: vehicle parking restrictions, public transportation and all kinds of policies such as traffic calming, enforcement, education, budgets, encouragement policies, end-of-trip and others.

Local MNT planning – putting people before transport, favouring NMT over motorised transport, network establishment, safe infrastructure, increase mode shares, regulations and enforcement, more equitable allocation of road space, encouraging greater NMT, options of financial assistance for increased NMT use.

The quality of pedestrian and bicycle infrastructure– across the board, current bicycle infrastructure is “almost routinely to be of poor or haphazard quality, disconnected and insufficiently part of a network” with only a few exceptions in South Africa and Brazil (p 25).

Funding for NMT – Nairobi (Kenya) is the only place to “commit to ensuring 20% of its existing and future road construction budget is allocated to NMT and public transport infrastructure and services” (p 26).

Data quality and institutional capacity – data is a major substantive gap in NMT planning and for transportation planning


Source: UN Global Outlook on Walking and Cycling Report 2016


Other interesting discussion points were
-public transport transformation or improvement
-Focus on vulnerable groups in African NMT policies
-Impact and stats on road deaths

Quotables from the report

  • A key government official from one of Africa’s largest economies told us that ‘the use of cars … is based on a colonial legacy of associating motorised transportation with education, affluence and elevated status in society. Therefore, the attitude towards NMT tends towards negativity. Thus the use of bicycles, walking and wheeling are associated with the poor’ (p 35).
  • Nigerian transport officials have described to us how ‘acquiring a car is a goal for most citizens who believe riding a bicycle [or walking] is less safe, less convenient, and less attractive, making the forecast decline of NMT a self-fulling prophecy….’ (p 35).
  • When speaking about India – ‘The marginalisation [of NMT] is seen in the backdrop of an emerging automobile culture linked with rising incomes, post-liberalisation and skewed notions of modernity. The continued dominance of motorised modes seeks to claim a larger share of road space mirroring the social power structure’ (Joshi & Joseph 35).

Outcomes and recommendations
The report then concludes with a country NMT summary for each of the participating nations, that identifies:
1. National NMT commitments
2. Civic society and social enterprise
3. For some countries, there is a focus box with extra details on a pertinent issue, facts, project or factors – which are insightful and very pertinent.

Source: UN Global Outlook on Walking and Cycling Report 2016


The UN: Global Outlook on Walking and Cycling Report goes to the heart of my PhD research, and I was very excited when I found it. To date, it has been frustrating for me as a researcher investigating the intersection of poverty, gender, culture and location – as there has been such recognition gap in the academic and grey literature about the impact of transportation on rural and impoverished countries. With publications like this report, access and use of bicycles are now (finally) gaining attention. Such a pity it took until this year for such a report to be published- but better now than never!

I like this report as it is clear, informative and easy to digest. It condenses critical content well and is also unique in having what I think, is quite a positive view for future transportation improvements.This report will go a long way in promoting and communicating the complexities, restrictions and issues involved in people being able/not to access transport, as this is such a critical development issue – there is no point building more health clinics and hospitals if people cannot physically get there to benefit from such services!

Well done UN Transport department on your thoughtful and informative report – it is wonderful to see bicycles (and walking) being placed firmly on the international development policy agenda.


Source: UN Global Outlook on Walking and Cycling Report 2016

2016 Super Sunday Recreational (Bike) count

In a couple of days, on Sunday 13th November, Australia’s Bicycle Network is undertaking its  annual bike path user audits. These counts are done each year to collect bicycle use data that help local councils accurately monitor and plan for current and future bicycle path use and infrastructure. This week will be the Super Sunday Recreational Bike Count.

Each year nationally, there is a Super Tuesday Commuter Bike Count (usually held in March) and a Super Sunday Recreational Count. These counts contribute to informing and guiding bike riding investment and initiatives across Australia and local councils self-nominate to participate. It is always interesting to which are the progressive councils that opt in and see the value and necessity of investigating urban bike path use (ideas to consider when you are looking at buying your next property?). It is great to see a rise in the number of local councils participating in this initiative, but yet again, not bloody enough interest or effort from QLD authorities to support ANY type of bike use!

As a research and activist working at the intersection of bicycles and community development – these kinds of initiatives are right up my alley. Although they may seem lame to some, the political and policy making power that this kind of data can leverage would be surprising to the average joe.

If you have ever found yourself muttering about the condition or lack of bike paths, or about the absence of council support and understanding for your particular bike riding needs – this is a small, but proactive and immediate action you can take to effect sustainable and positive change in your local area.


Specifics about the 2016 Super Sunday Recreational Bike Count.

This particular audit is being held in various locations in Australia this Sunday 13th Nov from 9 am – 1 pm (7-11am in NT & QLD) to ascertain:

  1. numbers of uses on trails and paths
  2. Which trails and paths are being used
  3. When trails are being used and by/with whom

To collect this qualitative data, a visual count of recreational bike riders and other users of the bike paths is required. To this end, the Bicycle Network has sent out an invitation for volunteers to help count and monitor selected sites to count rider (and other user) movements through particular sites. All equipment is provided.


What do I get out of it?

Although you do not get paid as an official ‘volunteer’, each data site is allocated $120 to go towards a charity or NGO that you can nominate. as well as contributing to supporting and informing productive bicycle use in your local area.  It is not a particularly taxing activity, on the contrary, it is a great day out. As a data collector, you get to see and meet lots of like-minded people in your area, brag to your mates that you were out making a difference to make their daily rides better – and there is also the bonus that you are actively contributing to generating data and outcomes that are integral to the maintenance and sustainability of future bicycle use for everyone Australia wide.


Get involved!

I STRONGLY urge you to get involved.

If you have not already registered to count, please consider doing so – take a mate or the family and make a morning of it.

Or conversely, make and extra point this Sunday to get out on your bike and ride paths in the locales listed below to get counted as many times as possible to add your “voice’ to increase investment in urban bicycle facilities.

The paths most focused on for these counts are key recreational paths, particularly along waterways, beaches and parks – so get out there on your two wheels!


Register here

For more info, check out the Super Counts – see the Bicycle Network.

Source: Bicycle Network

Areas involved for the 2016 Sunday Super count

NSW

  • Canterbury- Bankstown
  • Inner West
  • Lake Macquarie
  • Northern Beaches
  • Parramatta
  • Randwick
  • Southerland Shire

NT

  • Darwin

QLD

  • Whitsunday

SA

  • Mitcham
  • Norwood Payneham St Peters

VIC

  • Ballarat
  • Boroondara
  • Frankston
  • Greater Bendigo
  • Greater Dandenong
  • Greater Geelong
  • Hobson’s Bay
  • Maribyrnong
  • Melbourne
  • Monash
  • Moonee Valley
  • Nillumbik
  • Stonnington
  • Whitehorse
  • Wyndham
  • Yarra
  • Yarra Ranges

WA

  • Perth
  • Cockburn
  • Cottlesloe
  • Fremantle
  • Mandurah


Source: Bicycle Network

Bihar – Mukhyamantri Cycle Yogina

While reading though some research for my Lit Review, I came across this article: Ghatak, M., Kumar, C., & Mitra, S. (2013). Cash versus kind: Understanding the preferences of the bicycle-programme beneficiaries in Bihar. London, UK: International Growth Centre.

I have previously posted about this program, as it looks like a great initiative, so I was interested to read more about it, but was shocked by a few of the program details and findings that (of course) were not included in this programs’  previous promotions.

Review of the report.

This article is looking at cash transfer schemes and specifically using one case study, the Bihar Mukhyamantri Cycle Yogina (Chief Minister’s Bicycle Programme) a Cash for Kind (Bicycle) program to discuss some of the preferences of the bicycle beneficiancies of this program. It is not analyzing the program as such, although some interesting program results are given which I will expand on, but this paper is looking at to the recipients prefer to get the cash or the bicycle – and why.

Cash for Kind program are where the government disperses cash to recipients, who then use the cash to access a certain ‘kind’ of goods (or service) – usually something that is predetermined and linked as a condition for receiving the cash – in this case the money was to purchase a bicycle for all 9th grade students enrolled in school.

This report is 22 pages, so I am not going to give you all the results and details, but here is a few of the more interesting aspects of the report.

Program Background

The Bihar bike program is a well-known Indian program which provided ALL the 14 year-old girls (9th grade) in the whole state with bicycles. Bihar is one of India’s Eastern States that boarders Nepal and is considered to be one of the most impoverished states in India. The Mukhyamantri Cycle Yogina originally started in 2006 and provided Rs 2,400 for purchasing bicycles but was only for the girls. In 2009-2010 the program was expanded to include all the boys in the state of the same age and for the academic year of 2011-2012 the cash was increased to Rs 2500 per student. In 2012 – 2013, a conditional change was made that only students who maintained a 75% attendance at school were eligible.

So this report is a follow up of this program and was undertaken Sept – Oct 2012 over 36 villages and involved surveying 840 households (as a representative sample of the whole district) of which 958 bike recipients lived (some households had more than one child in the program).

Some of the key results

  • Do the benefits reach the intended beneficiaries – overall, yes.
  • Overall 90% of the beneficiaries reported being happy with this program (no grievances)
  • Issues of corruption – corruption can occur by various actors at various stages, but for this program it was difficult to do and corruption was considered to be very low.

Corruption opportunities:

  •  Ghost beneficiaries
  •  Enrolled in multiple schools – double benefits
  •  Was the accurate amount of $$ received?
  •  Receiving other benefits/services (not a bike)
  • Program administrators skimming a commission by using their own voucher or coupon system
  • Even though there were areas where corruption could occur, not much did with 93.3% reporting having received the correct amount – meaning 56 households received less than they were entitled to.
  • Results show that 98% of those who received the cash/voucher used it as required to purchase a new bicycle – over the course of a whole state – that is a pretty amazing result.
  • 45% said they would prefer cash instead of a bicycle

Rest of the report – some scary details

The rest of the report discusses the determinates of why certain households choose a preference between cash and kind (bicycle) – for example the quality of the bike was mentioned as one of the determinants for choosing cash or bike.

In the discussion, the report indicates a few interesting and very disturbing features of this program.

  • For example, one of the supply side conditions, and the way the program was set up, was that the beneficiaries were provided with cash (provided by the state, but distributed by the teachers at school), then they went out and purchased a bicycle with that cash and brought back the receipt as evidence of a bike purchase. Interestingly, this was not how the full program was implemented. Some districts deviated from this system and 30% of the beneficiaries were required to submit a receipt BEFORE they received the cash for the bike.

This meant 3 things: 1. People had to either purchase the bike with their own money, or 2. Get a fake receipt and 3. This would put extra financial strain on the poorest of the poor, of which this program was trying to help, but forcing into a compromised situation.

  • There were huge delays of payment to the recipients of up to 6-months.
  • Most troubling is, that the program provided an inadequate amount of money to purchase a bike in the first place – 98% of beneficiaries had to add money a significant amount of money to the program cash to buy a bike – on average Rs 979.
  • The market price for the three CHEAPEST bike brands in the area Atals, Avon and Hero (of which about 80% of the beneficiaries selected) range in price of Rs 3100 – 3300, but the government supplied only Rs 2500 – meaning that pretty much all of the recipients had to make up the difference themselves. For the richer households this comes out of savings, for the poorer families – this puts them further into debt, with 25% of all the recipients having to BORROW money to buy a bike – thus indebting them into poverty even further.

And this report states that 90% of the recipients were happy with the program!!??

Don’t get me wrong, the program is ambitious on many levels and you cannot get everything right – and the premise of supplying a new bike to increase school access is something I am very supportive of. However, ethically I have a major problem with programs whose conditionality has a direct and immediate negative consequence for the recipients when program organisers tout the program a success.

Such an error is easily rectifiable with A) doing the right homework to find out how much money is actually needed to buy a bike before implementation and B) increasing the government’s allocation to all beneficiaries if the program is already in effect.

Loan sharks anyone?

The report acknowledges that there is a ‘trade-off between universality and corruption’ meaning that beneficiary needs need to be balanced with the level of leakage and corruption. But given the opening stats  on the low corruption level for this program (98% of recipients got the right amount of cash = no corruption), it is hardly justifiable to decrease the reimbursement amount so much that being involved in the program diminishes the possible benefits to such a point where the needs of the beneficiaries are negatively compounded now three fold from having borrowed money to be in the program. Loan sharks anyone?

As a community development practitioner, I find these kind of programs disturbing, as many of them look good in the NGO reports and social media, but by digging a little deeper there are some interesting lessons to be learnt for future review, modifications and application.

I appreciate that this program is on a massive scale and is one of the first of its kind in the world, but critical features such as supplying the correct amount are basic provisions that should have been addressed before implementation.

I would be very interested to hear the rational given for this cash transfer amount for this program.

Source: blogs.lse.ac.uk

Colombia: Planning cities for people

By Mauricio Gonzalez – Guest Blogger


Planning cities for people – an international perspective by Enrique Penalosa

Big crowded cities, especially those in developing countries, have to deal with mobility. This issue is a determinant when it comes to measuring living standards. That said, Enrique Penalosa, the former Mayor of Bogota City in Colombia, argues that it is impossible to imagine a city without imagining the transport system first. Therefore, this post is about the change that can be created in a city that is designed for people rather than for cars. Which kind of city do you think would be more modern?

Many people would say that a city with more facilities for technological advances and one that is more futuristic and integrative of the 21st a city is better. However, to what extent do you think that model is sustainable and what kinds of people do you think could live in a city that is more focused on the devices than on themselves?

By comparing cities like Bogota, Stambul, London, New York, Amsterdam and others around the world, a contrast is revealed regarding the importance of people of living in cities. Humans are pedestrians, not machines. Cars were created to shorten distances, but cities have to be designed so they are enjoyable spaces. A beautiful city is, therefore, one that integrates the outdoors.

Source: Youtube - Bogota Bureau.com

The aim of cars and any transportation system is to take people from one place to another safely. Public transport is considered by Enrique Penalosa as an expression of democracy. Building cities for citizens is a good sign that shows that the government respects all kind of citizens, including those who cannot afford a car.

When you see modernised cities, you can find wide sidewalks where people can walk and enjoy with their children.

Source: Youtube – Bogota Bureau.com

In undeveloped countries, between 10% and 30% of people have cars. In Bogota, for instance, only 20% of people have a car. In such countries, the lack of development is evident when you see people without cars. In these places, people with no cars are considered to be third class citizens and people with them, are considered to be first class.

Furthermore, sidewalks should not be considered as being part of the streets, but as being part of plazas and parks where people can enjoy being with each other. To this end, Penalosa argues that a city that is designed for 20% of the population, is not a democracy and sidewalks are for enjoying the space, not just for passing by.


Source: Streetsblog.com

Source: Streetsblog.com


Source: blog.rmi.org


Overall, the use of bicycles is not enough. Bicycles have to be part of the political agenda when it comes to planning proper infrastructure that facilitates the benefits non-motor vehicles and public transport. It is recommended that people stop seeing buses and bicycles as means of transport for the poor. Instead, they are important cultural tools that are evidence of development and high living standards.


Enrique Peñalosa – “Planning Cities for People: An International Perspective”.

Mauricio Gonzalez is our Guest Blogger, unveiling some of South America’s bicycle culture for the next fortnight from 20th June to 2nd July.

Japan: Bicycles for healthy and environment-friendly town development

 by Sachie Togashiki

In looking for evidence to show the social changes made by the use of bicycles, I found an interesting video. In the video, a Japanese man, Satoshi Hikita, who works for a television station, and who commutes by bicycle for 24 km, delivered a lecture about using bicycles for environment-friendly and healthy town development. The video contains the interview Mr. Hikita gave after his lecture. The lecture was delivered in Nichinan, Miyazaki prefecture, where he was born, on 8th July 2011. Mr. Hikita gave interesting arguments to explain how bicycles contribute to town development.

Main arguments presented

He claims that using bicycles has benefits for both individuals and society. Individual benefits are: promoting fitness, saving money, and furthering familiarity with local town environs. On the other hand, the social benefits are mitigation of traffic jams, reduction of traffic fatalities and medical expenses, and eco-friendly traffic. He also argues that these benefits cannot be achieved by using cars because they emit carbon dioxide, which contributes to global warming; people don’t exercise when they drive a car, which is not healthy, and using a car might be more expensive in the longer term because oil prices will rise more and more.

Mr. Hikita argues that town development can benefit by promoting bicycles because the immediate appeal of the local environment can best be felt on foot or on a bicycle. This means the more people use bicycles in the town, the more they can personally and directly feel the attraction of the place. He cites the examples of Tokyo in Japan and cities in the United States; where young people prefer to go, enjoying the city on foot or a bicycle, not a car and have been developed through people’s interaction and communication. Mr. Hikita maintains that riding bicycles encourages us to interact with people and to fully appreciate our local environment, as well as being a convenient mode of transport.

Comment

After watching this video, I was intrigued by Mr. Hikita’s idea of how the planning of cities and towns was influenced by the use of bicycles. Even though I lived in Tokyo before coming to Australia, I didn’t notice that people best enjoy in the city on foot or a bicycle. I agree with Mr. Hikita when he says that cities can’t be enjoyed by cars because so many interesting places are missed, such as lots of interesting and mysterious shops or galleries on narrow streets where cars can’t go through. As he insists, a town’s attraction can be found not by cars, but by bicycles. If town planning includes promoting the use of bicycles, not only can people have an enjoyable town, they have healthy and eco-friendly lives today and tomorrow.


Sachie Togashiki is our Guest Blogger, unveiling some of Japan’s bicycle culture for the next fortnight from 11th April to 24th April.